Photo by Photo by Jair Lázaro / Unsplash
Introduction
It's important to monitor your applications so that you can act fast when problems occurs. When it comes to web applications it's common to have a /health endpoint that responds back with the status of your application. Usually a response indicates that everything is OK. If no response (timeout) or a 500 Internal Server Error response usually means that you have a problem. When using Kubernetes, Docker or basically any cloud provider you can also choose to spin up new instances of your application if any of your running instances responds with a non OK status.
In ASP.NET Core, Microsoft provides a health check middleware that can help you with creating your own health checks.
There's a bunch of third party tools like Pingdom, Uptime Robot and Site 24x7 that can help you keep track of your applications health. What they all have in common is that they send a HTTP request to your health endpoint and then you can configure alarms/notifications based on the response status code.
You can say that it's somewhat of an "outside in approach".
- Call to your service from the "outside".
- Act on the response (or lack of).
But what if you want to monitor your non web applications (console applications etc)? What if you don't have a web server?
The "inside out approach"
This approach relies on that you are indexing your logs in some kind of log aggregator like ELK, Splunk or Application Insights/Azure Monitor.
The idea is that your application logs a heartbeat every x seconds and then you configure some alarm that will trigger if 1 or more heartbeats has been missed. No heartbeats == application is down/having some problems.
It's really simple to set this up when using dotnet core, I will create a HostedService, or in this case, use the Background Service class.
public class HeartbeatLoggerHostedService : BackgroundService
{
    private readonly string _applicationName;
    private readonly TimeSpan _interval;
    private readonly ILogger<HeartbeatLoggerHostedService> _logger;

    // As pointed out by Valdis (https://twitter.com/tech_fellow/status/1290191091015262208)
    // you should probably use the IOptions<> approach instead of injecting IConfiguration directly.
    // I use IConfiguration just to minimize the amount of code in this blog post.

    public HeartbeatLoggerHostedService(
        ILogger<HeartbeatLoggerHostedService> logger,
        IConfiguration configuration)
    {
        _logger = logger ?? throw new ArgumentNullException(nameof(logger));
        _applicationName = configuration.GetValue<string>("Application:Name") ?? throw new Exception("Missing 'Application:Name' in Configuration");
        _interval = configuration.GetValue<TimeSpan?>("Logging:Heartbeat:Interval") ?? throw new Exception("Missing 'Logging:Heartbeat:Interval' in Configuration");
    }

    protected override async Task ExecuteAsync(CancellationToken stoppingToken)
    {
        while (!stoppingToken.IsCancellationRequested)
        {
            _logger.LogInformation("Heartbeat from {ApplicationName}", _applicationName);
            await Task.Delay(_interval, stoppingToken);
        }
    }
}
The logic here is really simple, I create a while loop that will log a heartbeat and then wait x seconds before logging the next heartbeat.
Then I just register the service in the DI container like this:
.ConfigureServices((context, services) =>
{
    ...
    services.AddHostedService<HeartbeatLoggerHostedService>();
    ...
})
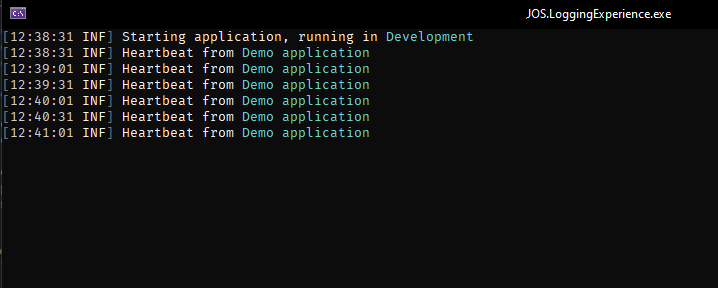
That's all there is to it, now when I run my application a heartbeat will be logged every 30 second.
What's great is that this approach will work for both web and console applications. I tend to use a combination of heartbeat logging and health endpoints to monitor my web applications.

